 Machine Learning
Logistic Regression using Newton's Method
While gradient descent is more commonly used to solve logistic regression problems, another important method is known as Newton's method, which is what we will explore in this exercise.
Logistic regression is the process of predicting the probability of an event taking place. We are given a set of independent variables, and a dependent variable that is limited to either 0 or 1. Our task involves learning some parameters that can predict the value of the dependent variable using the independent variables.
Note: Contrary to what the name implies, logistic regression is actually not regression, but rather a classification problem! This is because our target space is discrete and not continuous, which is unlike the setting of most regression problems.
Definition
Suppose we are given a matrix that holds values of independent variables.
is of size
n x d, where is the number of data points we have, and
is the number of independent variables we have:
We are also given a vector of targets
:
where .
Each row in corresponds to a single element in
. Thus, we can hypothesize the following relationship between a single row in
and a single element in
:
where:
is the intercept, or the bias
is the set of
regression coefficients, or the weights of
with respect to
is the step function, i.e. a function that returns 1 if
is positive and 0 otherwise
is the error in our
prediction
For convenience, we can define a matrix that is constructed by padding a column of ones to the left-hand side of
:
Note that is of size
n x (d + 1).
We also define vector as the series of weights:
Note that is a vector of length
.
Now, we can simplify our hypothesis in matrix form:
Activation Function
Let us now take a quick detour to explore a very important set of functions known as activation functions.
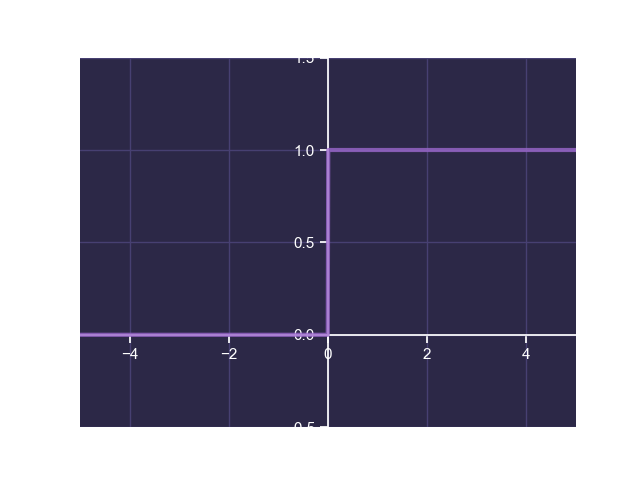
Before we explore activation functions and why they are needed, let's ask ourselves why they are needed at all by looking at the step function :

The step function yields an output of 0 and 1 if is negative and positive respectively. Although this is a useful function in determining whether our output should be a 0 or a 1, the plot above should help us note a discontinuity at
, where the output jumps from 0 to 1. Unfortunately, this discontinuity implies that the step function is not differentiable at
, making it unsuitable for usage in a learning process.
So what do we do? We need a function that does jump from 0 to 1 at , but at the same time is close to 0 when
is negative, and is also close to 1 when
is positive. Enter the sigmoid function!
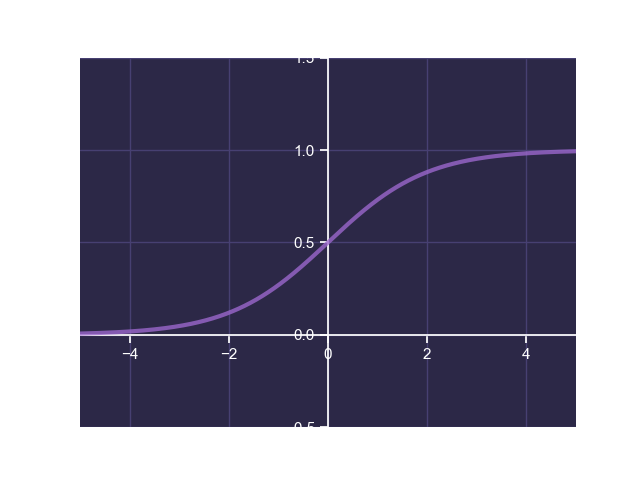
The sigmoid activation function (also known as the logistic function) is defined as follows:
If we look at the plot of this function, we can see that this function is exactly what we're looking for:

This is perfect! It gets closer and closer to 0 as grows negatively large, and closer and closer to 1 as
grows positively large. It is also a continuous function, meaning it is differentiable anywhere. To top it off, because the sigmoid function's output lies anywhere between 0 and 1, we can use this to model the probability of the output being 0 or 1.
The sigmoid function is one of many activation functions used in machine learning. Other common activation functions include the hyperbolic tangent function and the rectified linear unit function.
Loss Function
Now that we have defined the sigmoid activation function, we can use it to model our output defined previously:
where is our prediction for
.
We can use this to define a loss function that can help us identify how good our estimation is.
This loss function is also known as the binary cross-entropy loss.
This is a lot to process at once, so let's break this down by considering the row:
where is the
row in
, and our prediction for the
target in
.
We know that the vector only contains 0s or 1s. This means that
can only be 0 or 1. If
, our
loss becomes:
If , our
loss becomes:
This shows that only one of the terms is relevant in our loss function, depending on if is 0 or 1.
But why do we take the logarithm? This will become clear in the next section where we take the derivative of the loss.
Newton's Method
In order to develop an algorithm that can help us learn the optimal weights , we take the derivative of the loss function
. Before we try that, let us simplify the loss function a bit:
Now that we have the loss function , we must compute what is known as the Hessian matrix,
:
To work out the Hessian we can take the partial derivative of the loss function
with respect to a single weight
:
where is the
row of
.
Now we can take the derivative one more time, with respect to weight :
where is the Hadamard product operator, representing an element-wise vector multiplication.
The result above gives us what the element of the Hessian matrix
will be. We can simplify this to the following:
where is the matrix such that:
where .
Now that we have our Hessian matrix , we can perform Newton's method to iteratively obtain our solution. In this process, we take sequential steps towards the optimal solution, guided by the gradient vector and the Hessian matrix. Using Newton's method, we can update our weights
using the following update equation:
where are the weights at timestep
and
is the gradient vector, which can be generalized from our equation for
:
Caution: While Newton's method is often efficient, the convergence of Newton's method can be dependent on the initially chosen weights, and given certain initial weights, may not converge ever. Additionally, sometimes the Hessian may be a singular matrix, meaning that the inverse of the Hessian may not exist. To combat this, we often take the pseudo-inverse of the Hessian.
But if this is an iterative process, when do we stop? We know when to stop based on how small our gradient is. If our gradient is very small, we know that we are likely very close to the optimal solution, and hence we can stop. There are many different termination criteria that can be used, but the one we can employ in this exercise involves checking that the maximum value of the absolute value of the gradient vector is below a certain tolerance value, and terminating the process if so:
where is defined to be a very small number.
However, this may not always be sufficient. Sometimes, our given data is not linearly separable and we may never obtain our termination criteria. Because of this, it is also helpful to define a maximum number of iterations, after which we will terminate the process even if we don't have a good solution.
Performance Metric
We need a performance metric to determine how good our solution is. To this end, we can simply use the accuracy of our prediction. Before we define the accuracy of prediction, we must define a few other terms:
| Actually 1 | Actually 0 | |
|---|---|---|
| Predicted 1 | True Positive | False Positive |
| Predicted 0 | False Negative | True Negative |
- True Positives are data points that are 1s and have been successfully predicted to be 1s
- False Positives are data points that are 0s but have been erroneously predicted to be 1s
- False Negatives are data points that are 1s and have been erroneously predicted to be 0s
- True Positives are data points that are 0s and have been successfully predicted to be 0s
We define our accuracy metric to be the fraction of data points that have been identified correctly. In other words:
where ,
,
, and
are the number of true positives, true negatives, false positives, and false negatives respectively in our prediction.
In the case of this exercise, the accuracy metric can be defined as follows:
This will yield a value between 0 and 1 indicating how good our prediction is.
Exercise
Write a program that performs logistic regression using Newton's method. Complete the fit(), predict(), and score() methods:
fit()takes in arraysXandy, and computes and stores the weightswusing Newton's method. Start with weightswinitialized to zero. Use thetoleranceparameter as the tolerance to determine the termination criteria, and themax_itersparameter to put a cap on the total number of iterations.predict()takes in arrayXand returns a predicted arrayy_predusing the stored weightsw. Note that they_predmust be an array of 0s and 1s.score()takes in arraysXandy, predicts they_predvalues usingXand the stored weightsw, and then usesy_predandyarrays to compute and return the prediction accuracy
Sample Test Cases
Test Case 1
Input:
[
  [[0, 0],
   [0, 1],
   [1, 0],
   [1, 1]],
   [0, 0, 0, 1],
  [[0, 0],
   [0, 1],
   [1, 0],
   [1, 1]],
   [0, 0, 0, 1]
]
Output:
w = [-8.535, 5.570, 5.570]
y_pred = [0, 0, 0, 1]
accuracy = 1.0
Note: The values listed for w represent one of many possible solutions.
Test Case 2
Input:
[
  [[0, 0],
   [0, 1],
   [1, 0],
   [1, 1]],
   [0, 1, 1, 1],
  [[0, 0],
   [0, 1],
   [1, 0],
   [1, 1]],
   [0, 1, 1, 1]
]
Output:
w = [-2.912, 6.778, 6.778]
y_pred = [0, 1, 1, 1]
accuracy = 1.0
Note: The values listed for w represent one of many possible solutions.
Test Case 3
Input:
[
  [[-3.75, -8.69 ],
   [-7.55, -11.79],
   [-18.38, 9.35 ]],
   [1, 1, 0],
  [[-3.75, -8.69 ],
   [-7.55, -11.79],
   [-18.38, 9.35 ]],
   [0, 1, 1]
]
Output:
w = [0.050, 0.354, -1.492]
y_pred = [1, 1, 0]
accuracy = 0.333
Note: The values listed for w represent one of many possible solutions.
