 Machine Learning
K-Nearest Neighbours
One of the simplest supervised, non-parametric machine learning classification algorithms is known as the K-Nearest Neighbours algorithm. For this exercise, we will explore and implement KNN.
Definition
In KNN classification, we are given a set of feature vector-target pairs:
What does this mean? This tells us that when the feature vector is , our target class is
.
Now suppose we are given a new feature vector and want to predict the target class
. How do we go about this? Before we answer that, we can compute a set of distances
that consists of the Euclidean distances between
and every point in
:
Once we have the distances, the idea is to obtain the -closest neighbours of
by picking the
-lowest distances in
, and note down their corresponding target classes. Among the target classes, we choose the most frequently occurring one to be
.
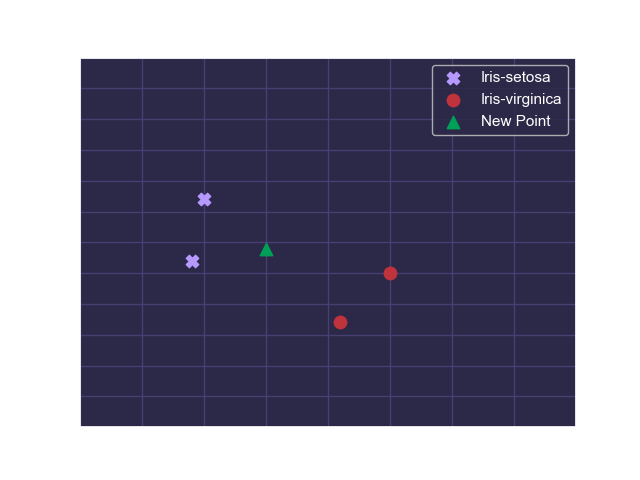
For example, consider a subset of the Iris dataset from the UCI Machine Learning Repository that includes data on different species of the Iris plant:

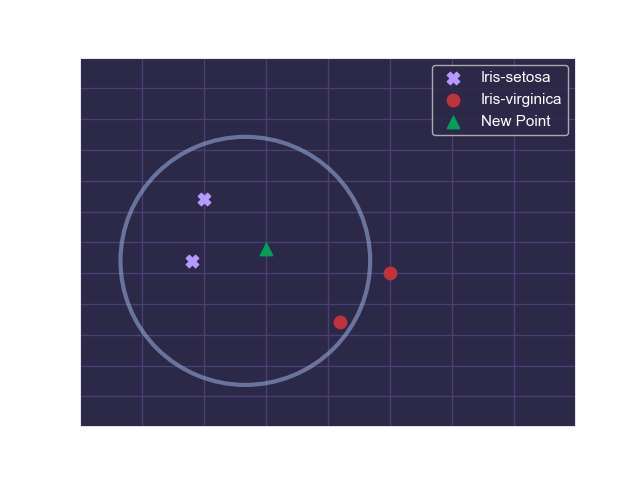
We know the blue points to be of class Iris-setosa and the red points to be of class Iris-virginica. But the green point is of an unknown class and must be classified. We can identify the top 3 nearest neighbours to the green point:

As we can see, out of the 3 nearest neighbours, 2 of them are of class Iris-setosa and 1 of them is of class Iris-virginica. Since Iris-setosa occurs more frequently than Iris-virginica, we choose Iris-setosa as the predicted target class .
Performance Metric
We also need a performance metric to determine how good our classification is. To this end, we can simply use the accuracy of our prediction. Before we define the accuracy of prediction, we must define a few other terms:
| Actually 1 | Actually 0 | |
|---|---|---|
| Predicted 1 | True Positive | False Positive |
| Predicted 0 | False Negative | True Negative |
- True Positives are data points that are 1s and have been successfully predicted to be 1s
- False Positives are data points that are 0s but have been erroneously predicted to be 1s
- False Negatives are data points that are 1s and have been erroneously predicted to be 0s
- True Positives are data points that are 0s and have been successfully predicted to be 0s
We define our accuracy metric to be the fraction of data points that have been identified correctly. In other words:
where ,
,
, and
are the number of true positives, true negatives, false positives, and false negatives respectively in our prediction.
In the case of this exercise, the accuracy metric can be defined as follows:
where is the number of points such that the predicted
is equal to the actual
, and
is the number of points such that the predicted
is not equal to the actual
. This will yield a value between 0 and 1 indicating how good our prediction is.
Exercise
Write a program that performs KNN classification. Complete the predict(), and score() methods:
fit()takes in arraysXandy, and stores this data (this function was already written for you)predict()takes in arrayXand number of neighboursk, and returns a predicted arrayy_predby performing KNN using the stored datascore()takes in arraysXandyand number of neighboursk, predicts they_predvalues usingXand the stored data, and then usesy_predandyarrays to compute and return the accuracy of prediction
You may assume there will be no ties between distances or target class frequencies.
Sample Test Cases
Test Case 1
Input:
[
  [[5,   3.6],
   [6.1, 2.6],
   [6.5, 3  ],
   [4.9, 3.1]],
   [0, 1, 1, 0],
  [[5.5, 3.2]],
   [0],
    2
]
Output:
y_pred = [0]
accuracy = 1.0
Test Case 2
Input:
[
  [[4.1, 0.2],
   [5.2, 0.8],
   [1.9, 2.2],
   [2,   1.4],
   [6.8, 0  ],
   [1.2, 3  ],
   [0.3, 2.4],
   [6.8, 0.8],
   [0.9, 0.1],
   [4.8, 2.1]],
   [0, 0, 1, 0, 0, 1, 1, 1, 1, 0],
  [[2,   2.8],
   [5.9, 1.1]],
   [0, 0],
    3
]
Output:
y_pred = [1, 0]
accuracy = 0.5
