 Machine Learning
K-Means Clustering
In this exercise we start diving into one of the most commonly used unsupervised learning algorithms known as K-means clustering.
Supervised & Unsupervised Learning
So what is unsupervised learning? And what is supervised learning?
Supervised learning is the set of algorithms and learning mechanisms that deal with labelled datasets. In other words, when the desired output or target of the data points is provided, we generally use supervised learning. Popular supervised learning algorithms include:
- Linear & Logistic Regression
- Decision Tree
- Random Forest
- Support Vector Machines
- Naive Bayes
- K-Nearest Neighbours
Unsupervised learning is the set of algorithms and learning mechanisms that deal with unlabelled datasets. In other words, when the desired output or target of the data points is not provided, we generally use unsupervised learning. Popular unsupervised learning algorithms included:
- K-Means Clustering
- Hierarchical Clustering
- Principal Component Analysis
- Self-Organizing Maps
Definition
Suppose we are given a matrix that holds values of independent variables.
is of size
n x d, where is the number of data points we have, and
is the number of independent variables we have:
Additionally, suppose we are given a value that represents the number of clusters.
Now consider a matrix that holds cluster centroids:
where is the coordinate of the
centroid in the
dimension. The centroids represent the coordinates of the centers of the clusters.
Finally we can define the output labels , where
is an array of
integers that can contain numbers from
.
represents the index of the centroid that is closest (using Euclidean distance) to the
data point.
For example, suppose we have and:
This means we have data points and centroids
.
For point :
- distance to
is
- distance to
is
Thus, since
is closer to
than
is. Similarly we find
and
.
Then, given the matrix , K-means clustering involves computing
and
such that
contains the indices of the centroids that are closest to each data point in
, and each centroid
in
represents the coordinates of the center of the data points that are labelled
:
where is the number of times label
appears in
and
is the set of indices where label
appears in
.
In the previous example, centroid is the closest centroid to points
and
. The center of these points is
, which is consistent with the location of centroid
. Similarly, centroid
is the closest centroid to point
. The center of this point is
, which is, once again, consistent with the location of centroid
. Because both centroids are consistent, this is a valid solution to K-means clustering.
The algorithm of computing K-means clusters is as follows:
- Randomly select centroids
- Compute
by computing the closest centroid to each data point in
- Given
, compute new centroids
- If the centroids change, go back to step 2, otherwise terminate the process
Intuition
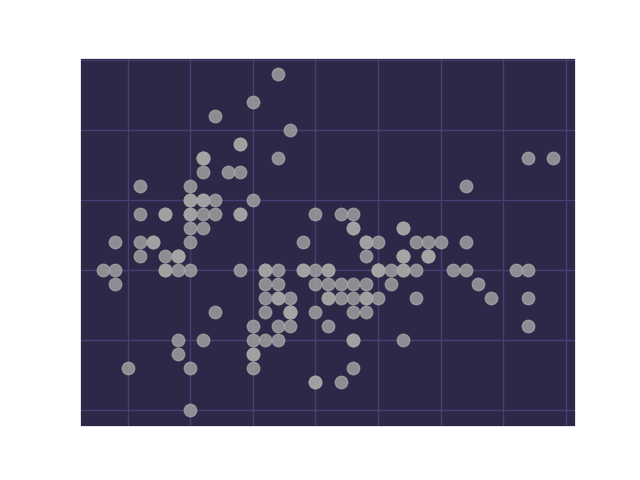
K-means clustering allows us to separate given data points into groups, in hopes that data points in the same groups will share characteristics. Consider, for example, a subset of the Iris dataset from the UCI Machine Learning Repository that includes data on different species of the Iris plant. We can visualize the distribution of sepal lengths and widths of the flowers using a scatter plot:

The flowers can be classified into 3 classes:
- Iris-setosa
- Iris-versicolor
- Iris-virginica
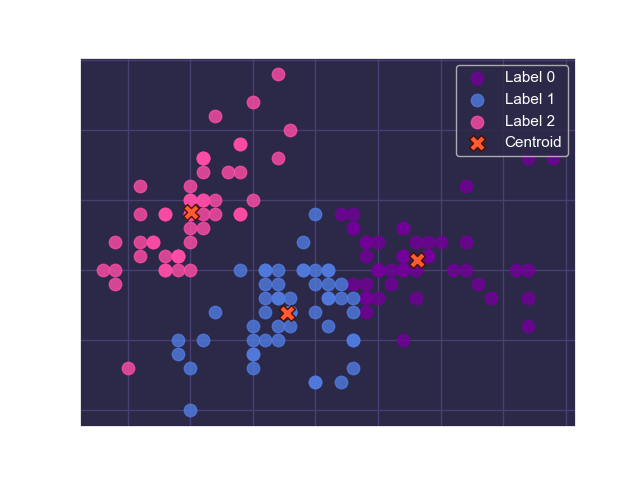
Without using the class labels of the dataset, we can apply K-means clustering to get an idea of how these classes are likely distributed. After performing K-means clustering, we get the following clusters and centroids:

Note that labels 0, 1, and 2 are completely arbitrary.
Now let's take a look at the actual labels to see how much K-means clustering has been able to capture:

As we can see, K-means clustering is able to almost completely isolate instances of the Iris-setosa class, and can somewhat differentiate between the Iris-versicolor and Iris-virginica classes! All this can be obtained without looking at the actual class labels in our dataset! This is what makes clustering algorithms so powerful.
Performance Metrics
When it comes to K-means clustering, there are typically two characteristics of the algorithm we are interested in:
- how close each point is to its respective centroid
- how far apart the centroids are
To obtain a well-performing clustering solution, we want to minimize the distance between each point and its respective centroid and maximize the distance between the centroids. Thus, we consider two metrics for K-means clustering: within-cluster sum of squares and between-clusters sum of squares.
Within-Cluster Sum of Squares
This is computed by summing up the squared distance between each point and its closest centroid:
The lower this is, the better performing our clustering algorithm is.
Between-Cluster Sum of Squares
This is computed by summing up the squared distance between each centroid and the center of all centroids :
is computed by taking the mean of all centroids:
The lower this is, the better performing our clustering algorithm is.
Exercise
Write a program that performs K-means clustering. Complete the fit(), predict(), and score() methods:
fit()takes in arrayXand number of clustersk, and returns thelabelsarray and thecentroidsmatrixpredict()takes in arrayXand returns the predictedlabelsarray based on the centroids computed in thefit()methodscore()takes in arrayX, computes the predictedlabels_predarray based on the centroids computed in thefit()method, and computes and returns thewcss_scoreandbcss_scorevalues
Sample Test Cases
Test Case 1
Input:
[
  [[ 7.3,  8.1]],
  [[-5.4, -4.3]],
  1
]
Output:
labels = [0]
centroids = [[7.3, 8.1]]
labels_pred = [0]
wcss_score = 315.05
bcss_score = 0.0
Test Case 2
Input:
[
  [[-8.1,  5.5],
   [-9.8, -0.1],
   [-7.1, -0.9],
   [-0.3,  2.3]],
  [[-4.3,  5.6]],
  2
]
Output:
labels = [1, 1, 1, 0]
labels_pred = [0]
centroids = [[-0.3, 2.3], [-8.333, 1.5]]
wcss_score = 26.89
bcss_score = 32.587
Note: The values listed for centroids represent one of many possible solutions.
